Stock Price Prediction with LSTM
Deep learning model using Long Short-Term Memory networks to forecast stock prices based on historical patterns. Analyzing markets from the US and Vietnam.
LSTM Model Implementation
Python Implementation
Complete pipeline from data preprocessing to prediction
# Section 1: Import needed libraries
import pandas as pd
import numpy as np
import matplotlib.pyplot as plt
from sklearn.preprocessing import MinMaxScaler
from keras.callbacks import ModelCheckpoint
from tensorflow.keras.models import load_model
from keras.models import Sequential, load_model
from keras.layers import LSTM, Dropout, Dense
from sklearn.metrics import r2_score, mean_absolute_error, mean_absolute_percentage_error

# Section 2: Read and Preprocess Data
from matplotlib.dates import YearLocator, DateFormatter, MonthLocator

df['DATE'] = pd.to_datetime(df['DATE'], format='%d/%m/%Y')
df = df.sort_values(by='DATE')

df['CLOSE'] = df['CLOSE'].astype(str).str.replace(',', '').astype(float)
df['OPEN'] = df['OPEN'].astype(str).str.replace(',', '').astype(float)
df['HIGH'] = df['HIGH'].astype(str).str.replace(',', '').astype(float)
df['LOW'] = df['LOW'].astype(str).str.replace(',', '').astype(float)

df['YEAR'] = df['DATE'].dt.year

# Visualize closing price
plt.figure(figsize=(10, 5))
plt.plot(df['DATE'], df['CLOSE'], label='CLOSE', color='red')
plt.xlabel('YEAR')
plt.ylabel('CLOSE')
plt.title('The closing price chart over the years')
plt.legend(loc='best')

# Section 3: Normalize Data & Split Train/Test
scaler = MinMaxScaler()
close_scaled = scaler.fit_transform(df[['CLOSE']])

train_size = int(len(close_scaled) * 0.8)
train_data = close_scaled[:train_size]
test_data = close_scaled[train_size:]

# Section 4: Create Sequences for LSTM
def create_sequences(data, seq_length):
    X, y = [], []
    for i in range(len(data) - seq_length):
        X.append(data[i:i+seq_length])
        y.append(data[i+seq_length])
    return np.array(X), np.array(y)

seq_length = 60
X_train, y_train = create_sequences(train_data, seq_length)
X_test, y_test = create_sequences(test_data, seq_length)

# Section 5: Build LSTM Model
model = Sequential([
    LSTM(50, return_sequences=True, input_shape=(seq_length, 1)),
    Dropout(0.2),
    LSTM(50, return_sequences=True),
    Dropout(0.2),
    LSTM(50),
    Dropout(0.2),
    Dense(1)
])

model.compile(optimizer='adam', loss='mean_squared_error')
model.fit(X_train, y_train, epochs=50, batch_size=32, validation_split=0.1)

# Section 6: Evaluate & Predict
predictions = model.predict(X_test)
predictions = scaler.inverse_transform(predictions)
y_test_actual = scaler.inverse_transform(y_test)

r2 = r2_score(y_test_actual, predictions)
mae = mean_absolute_error(y_test_actual, predictions)
mape = mean_absolute_percentage_error(y_test_actual, predictions)

print(f'R² Score: {r2:.4f}')
print(f'MAE: {mae:.4f}')
print(f'MAPE: {mape:.4f}%')AAPLUnited States
Apple Inc.
Apple Inc. is an American multinational technology company specializing in consumer electronics, software, and online services. The LSTM model analyzes historical stock price patterns to predict future movements.
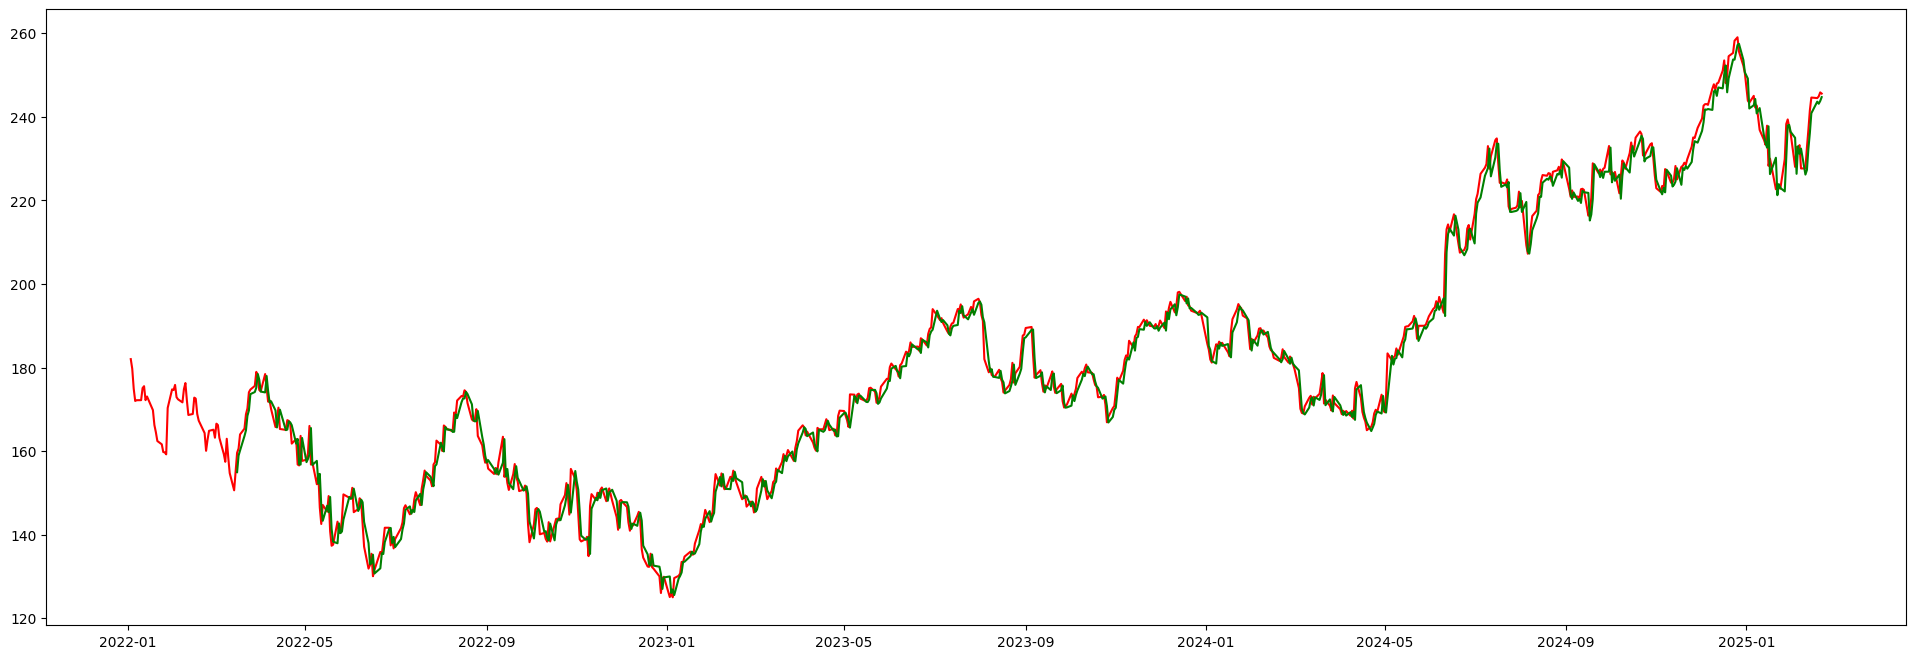
Green = Predicted Price•Red = Actual Price
VHMVietnam
Vinhomes
Vinhomes is Vietnam's leading real estate developer, known for large-scale urban developments. The LSTM model captures the unique characteristics of Vietnamese market dynamics to forecast stock trends.
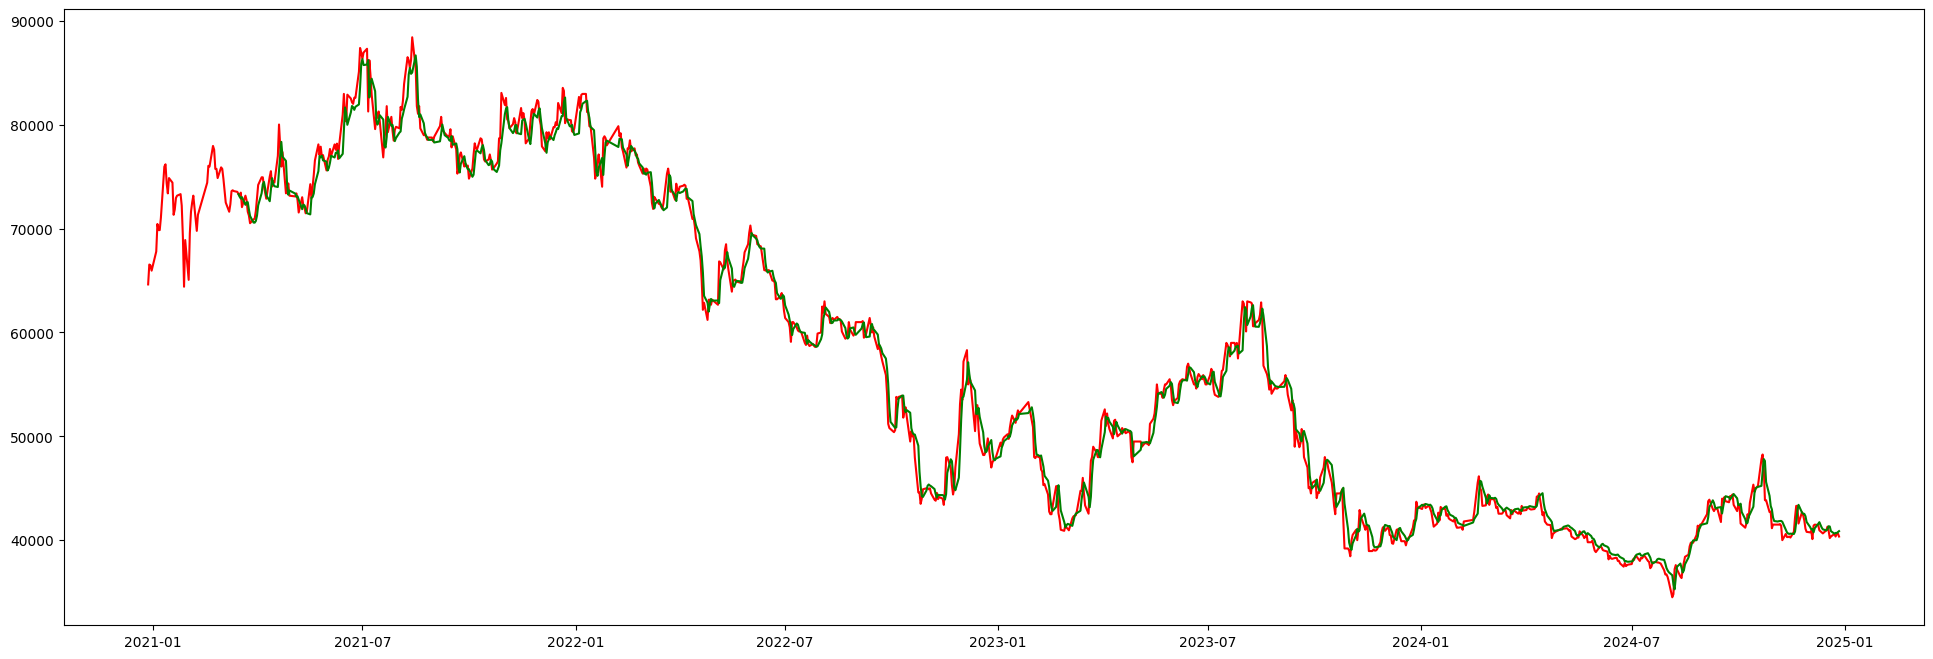
Green = Predicted Price•Red = Actual Price
Model Architecture
- •3-layer LSTM with 50 units each and dropout regularization
- •60-day sequence length for temporal pattern recognition
- •MinMaxScaler normalization for stable training
- •Adam optimizer with MSE loss function
Key Insights
- •LSTM effectively captures long-term dependencies in stock data
- •Dropout layers prevent overfitting on historical patterns
- •80/20 train-test split ensures robust validation
- •Model performs well on both developed and emerging markets