2
Basics
K-means Clustering
Theory
K-means is an unsupervised learning algorithm that partitions n observations into k clusters. Each observation belongs to the cluster with the nearest mean (centroid). The algorithm iteratively assigns data points to clusters and updates cluster centers until convergence.
Visualization
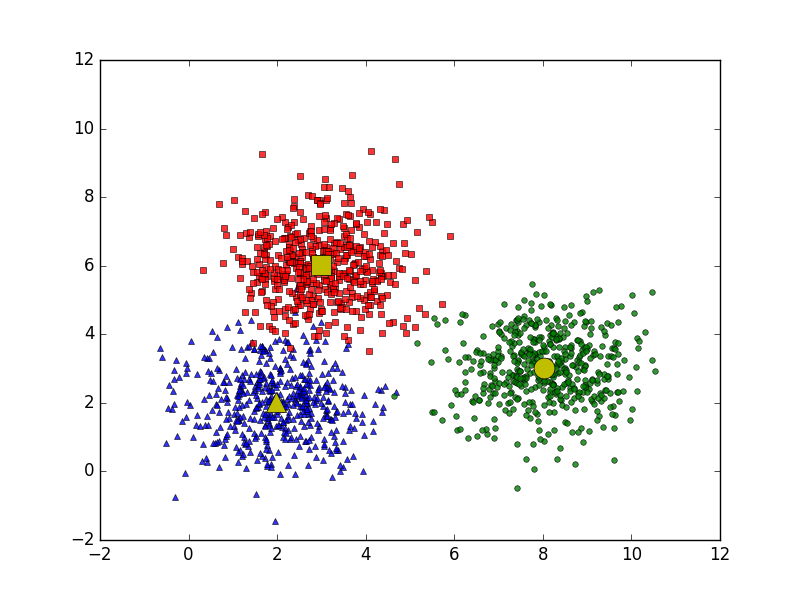
Mathematical Formulation
Algorithm:
1. Initialize k centroids randomly
2. Assign each point to nearest centroid
3. Recompute centroids as mean of assigned points
4. Repeat steps 2-3 until convergence

Objective: minimize Σ ||xᵢ - μⱼ||²
Code Example
import numpy as np
from sklearn.cluster import KMeans
import matplotlib.pyplot as plt

# Generate sample data
np.random.seed(42)
X = np.concatenate([
    np.random.randn(100, 2) + [2, 2],
    np.random.randn(100, 2) + [-2, -2],
    np.random.randn(100, 2) + [2, -2]
])

# Apply K-means
kmeans = KMeans(n_clusters=3, random_state=42)
labels = kmeans.fit_predict(X)
centroids = kmeans.cluster_centers_

# Visualize
plt.scatter(X[:, 0], X[:, 1], c=labels, cmap='viridis')
plt.scatter(centroids[:, 0], centroids[:, 1],
            c='red', marker='X', s=200,
            edgecolors='black', label='Centroids')
plt.legend()
plt.title('K-means Clustering')
plt.show()